
Google Analytics has become an incredibly powerful tool since it’s creation in November of 2005. Since then we’ve seen featured added and improved. We’ve seen new ways to collect data and use that data to better improve our websites. But as it’s grown complexity, a new user might have no idea what to look for when they jump into their Analytics account. In this article, I aim to make it a little more accessible for the average user.
I do not claim to be a Google Analytics expert. In fact, my background personally is much more front-end web development, graphic design, with a side of marketing. But I do expect to have a better understanding of Analytics than your average user since I often find myself in an Analytics account and using the data to better make web design decisions.
And before I begin, this is not a deep-dive into Google Analytics. I’m not qualified to write that post right now and I am sure that it would take many, many more words to fully explain every aspect of it. This is simply a rundown of all the features I personally find interesting and helpful for making educated marketing decisions.
Google Analytics Sidebar Navigation
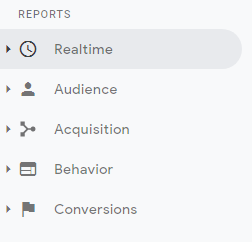
Google Analytics is huge! But, almost all of the reporting you’ll ever need to access can be found in these 5 reporting categories: Realtime, Audience, Acquisition, Behavior, Conversions.
Inside of each of these are many more expandable reporting options. From this navigation, you can find reports on everything from the age and gender of your audience to what pages most users went to, and in what order, while they were on your website. And if you do a little more work outside of Analytics, you can even track down where users came from specifically, and what campaign brought them to your site.
Realtime
In my opinion, this category is more for funsies and anything.
It’s not very often that you need to know how many people are on your website at this very moment… but it is a useful tool. Say you want to run an update, but want to make sure nobody is looking at your website? This can help with that.
I, and probably most developers that use Google Analytics, mostly just use Realtime to verify that your Google Analytics is working after we install it. :)
Audience
The audience category is where we start to get some actionable data. Every main level report category (besides Conversions) starts with an “Overview” link. This overview gives a pretty good.. well… overview of all the data within that category. In Audience’s case, it shows you your New vs Returning visitors pie graph, some users based on a selected metric. It also shows an overview of what languages people speak, what screen resolution, what country, etc.
All this data can be expanded upon if you go deeper into the rabbit hole. This is the overall theme of Google Analytics, btw. The deeper you dig, the more specific data you’ll find.
Demographics
In the demographics tab, you can learn things like Age and Gender. This data is only as good as the source it’s being pulled from. So, although this does give you some good general ideas about what your audience looks like, it may not be 100% accurate.
Geo > Location
Inside Audience > Geo there are two options: Language and Location. It’s very likely that your language is going to show you English, and the few different types of Englishes (EN-US, EN-CA, EN-GB, EN-UK, etc). But Location may give you some much better data.
The location report will show you which counties, states, cities, sometimes even neighborhoods you viewers are coming from. This data could be used to fine-tune what time different marketing campaigns go live, and potentially even what the marketing campaigns are focused on.
Behavior > New vs Returning
Under Audience > Behavior there are 4 options. One of those options is New vs Returning. This will give you a good idea of how well your website is growing with new visitors and how many of your old visitors are coming back.
User Flow
This one is great! This will show a visual representation of which pages users are visiting and in what order they are doing it. It also shows what pages people are dropping from your website. You can use this data for a lot of things.
For example, if you’re getting a lot of visitors to your homepage, but many of those are leaving without going anywhere else – maybe they are not seeing a clear next-step to take on your website. Or maybe, they just aren’t interested in what you have to offer based on how it’s represented on that homepage.
This User Flow report also can show what country, operating system, city (and much, much more) people are entering from. And from that data, it can show you what those specific audience groups are doing.
Aquisition
The acquisition category is super powerful. This is probably one of the most important data points you’ll be using because it can tell you if your Google Ads, Social Campaign, Email Marketing Campaigns, keywords, etc are performing well. Once you have baseline data, you can truly determine if it’s more or less likely to see an ROI for running some specific campaigns.
Campaigns and Why They’re Super Important
Okay, so this is really where the secret sauce of Google Analytics is located. GA will only tell you what it’s learned right? Well, if you don’t give it specific metrics to look for, it can’t report on them.
That’s where campaigns and the Google Link Builder comes in. By using this link builder provided by Google, you can create reportable data for your Analytics. Running a special July 4th Campaign? Set up a custom campaign ID for it for all your social media posts or Ads. Running multiple mediums for the same campaign? Name them accordingly using the medium and source attributes.
This is probably the biggest thing that’s overlooked. Your Google Analytics is only going to give you as much data as you pump into it. So if you’re not actively creating these links, you’re going to have limited or unusable data.
Behavior
The behavior reporting category will give you more information about how many page views and how long people stayed on a page before moving on. It also gives info on unique page views and bounce rates.
Behavior Flow
The behavior flow is very similar to the User Flow. In fact, at first glance, you may assume they are the same thing. Although they are similar, they do report on two different aspects of your users.
Whereas User Flow focuses on the volume of traffic and what pages see the most of it, Behavior Flow focuses more on what content is keeping the users engaged. But yeah… they really are similar.
Conversions
The conversions category will help you understand how many people convert to leads after landing on your page, but only if you do a few extra steps.
Goals
Goals are how the conversions category really starts to give you data. You have to set up your sales funnels and goal for your landing pages. To do this, you just tell Google Analytics which pages you’re tracking and what page you want the user to go to after they landed on that first page. You can do much more specific event-based tracking as well, but this works for the basic sales funnel that has unique pages per step.
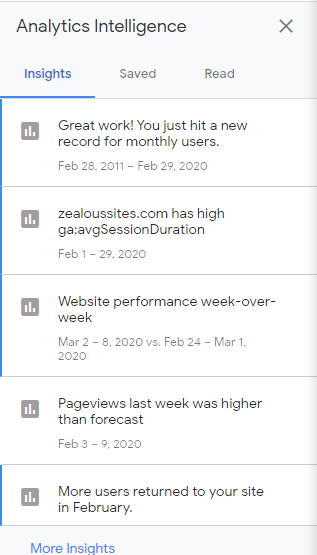
Insights
Insights is a bonus category! This can be found on the top right of your Google Analytics page. This AI-powered reporting will give you easy-to-read and understand reports. Things like “More users returned to your site in February” and “Website performance week-over-week.” Things like that.
If you’re just getting started with Google Analytics, this area will be your best friend. :)
Wrapping It Up
Google Analytics is an incredibly powerful tool with depths of information available if you just know where to look. Extrapolating actionable information from that data is where a marketing specialist comes in. If you’re reading through this and are overwhelmed or just uninterested in learning the ins-and-outs of Google Analytics, consider hiring Zealous Sites to do it for you. We love this stuff!
So yeah! If you found this article helpful, thought I missed something important, or just have something else to add; feel free to add a comment below! I hope it was at least a little bit helpful and keep an eye out for the next post next week!